Picking up on recent comments by Russ Roberts on the changes in the disability rolls over time, we thought we might revisit Social Security's data on the number of disabled workers collecting disability benefits for the years corresponding to the Great Recession. Beginning with the pre-recession baseline year of 2005, our first chart today shows the number of disabled workers counted as receiving Social Security disability insurance benefits for each year through 2011:

Here, we note that most of the change in the number of disabled workers from year to year is concentrated in older individuals, mostly Age 46 or older. We also note the moving peak of the leading edge of the Baby Boom generation from year to year, which we see shift from Age 58 for 2005 up to Age 64 in Age 2011.
In our next chart, we've extracted the net change in the number of disabled workers receiving Social Security disability insurance benefits from year to year, which we did by subtracting the previous year's number of disabled workers for the one-year-younger age group from the indicated age group:

This chart shows how many disabled workers were added to the number of Social Security disability benefit recipients with respect to the previous year's one-year-younger age group.
Here, we note that there is a distinct spike in disabled workers receiving Social Security disability benefits at Age 50, regardless of each year's economic climate. Here, we earlier found that this corresponds to the Social Security Administration's policy of not seriously challenging the disability claims of workers Age 50 or older.
But perhaps more importantly, in looking at the year-over-year change from 2005 to 2006 (identified as 2006 in the chart) and the year-over-year change from 2006 to 2007 (identified as 2007 in the chart), we find that the year-over-year change for these two pre-recession years are almost identical. This gives us a very good baseline from which we can determine the extent to which the Great Recession has influenced the number of individuals successfully claiming disability benefits in subsequent years.
That result is shown in our third chart, in which we've counted the number of surplus or excess disabled workers added to the number of disability claims in each year from 2007 through 2011 with respect to the net change recorded for each indicated age in 2006:

Adding up the values for each indicated age for each year, we find the number of surplus or excess disabled workers, or rather the number of disabled workers above and beyond what would be considered "normal" and might therefore be attributed to the Great Recession, were added to the disability rolls in the years from 2007 through 2011:
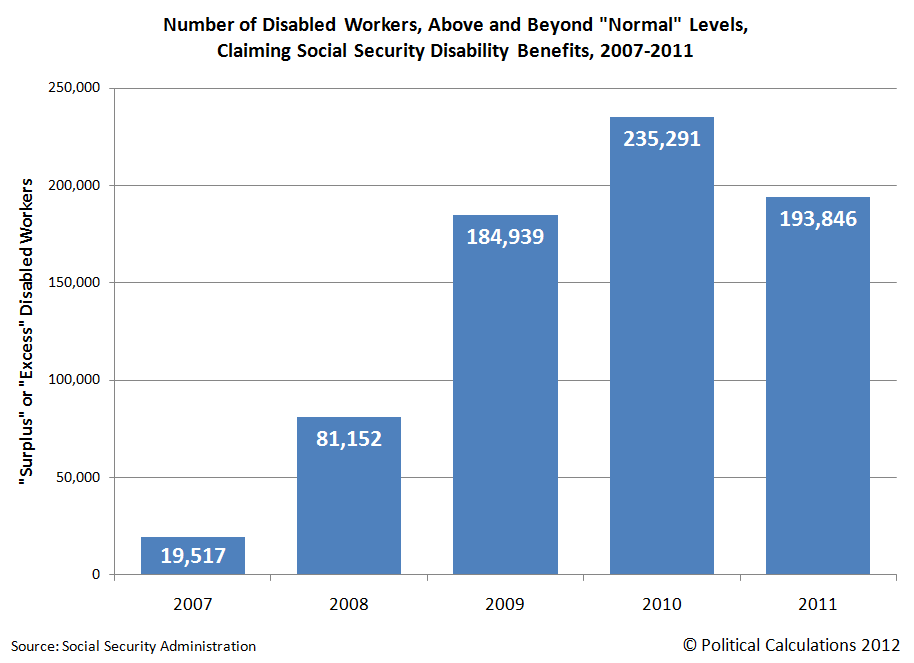
Altogether then, we estimate that some 695,228 individuals, above and beyond the numbers that might be considered to be normal, have filed for and received Social Security disability insurance benefits in response to the Great Recession in the years from 2008 through 2011. We also note that the timing of the increase in the disability rolls would correspond to when many of these individuals would have exhausted their unemployment benefits, suggesting that going on disability became an alternative to seeking gainful employment for these individuals.
And that's a big reason why Social Security's Disability Insurance Trust Fund is now projected to be fully depleted in less than four years time.
Data Sources
Social Security Administration.
Disabled worker beneficiaries in current payment status in December of indicated year, distributed by age and sex. 2005, 2006, 2007, 2008, 2009, 2010 and 2011. Accessed 27 August 2012.
Tidak ada komentar:
Posting Komentar