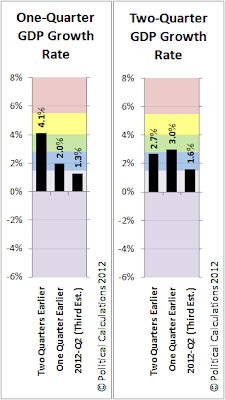
As we've long forecast, the BEA's third estimate of GDP for the second quarter of 2012 has confirmed that the U.S. economy is at least experiencing a microrecession. To see what we mean, our temperature charts on the right show the annualized one-quarter and two quarter-long growth rates for GDP shows how the most recent three quarters for GDP fit among the backdrop of the typical levels of GDP recorded during the past 30 years.
In the charts, the indicated temperature spectrum runs from the red "hot" zone, which indicates the kind of "heated" economic growth that might push the Federal Reserve to adopt policies aimed at slowing down the growth of the economy, through the green "comfortable" zone, on down to the purple "cold" or recessionary zone.
Through 2012-Q2, we see that the GDP growth rate has dipped into the "cold" zone indicating lackluster or near-recessionary level growth for the one-quarter side of our temperature chart, with an annualized growth rate of 1.3%. On the less volatile two-quarter temperature chart, we see that the U.S. economy is right at the margin dividing the "cool" and "cold" zones, right at an annualized growth rate of 1.6%.
Both results confirm that the U.S. economy in 2012-Q2 at least qualifies as having been in microrecession, which might be described as a recession that is either of too short duration or one that's perhaps too small in scope or severity to qualify as an outright national recession.
Will that continue into the third quarter of 2012? The one that just ended on 30 September 2012?
We'll take on that question tomorrow, when this link becomes active!

Tidak ada komentar:
Posting Komentar