Tampilkan postingan dengan label income inequality. Tampilkan semua postingan

Kamis, 25 Juli 2013

Total Compensation: U.S. Government Employees vs the Private Sector

How does the total compensation of the average U.S. federal government employee compare to that of the average U.S. individual income earner who works full-time, year-round?

To find out, we've taken the average cash incomes earned by each and added the average benefits that each receives through their employer as reported by the Congressional Budget Office in 2012. They found that:

On average for workers at all education levels, benefits for federal employees cost about $20 per hour worked, whereas benefits for private-sector employees cost $14, CBO estimates. Thus, benefits for federal workers cost 48 percent more per hour worked, on average, than benefits for private sector workers with similar attributes. Benefits also constituted a larger share of compensation for federal workers, accounting for 39 percent of the cost of total compensation, compared with 30 percent in the private sector.

We next visualized those numbers, in which we reveal the average total compensation of U.S. federal government employees and individual Americans who work in full time jobs all year long:

Average Total Compensation of Private Sector and Federal Government Employees in U.S., 2011

We find that while the average U.S. federal government employee makes $14,632 more in direct cash income than their private sector counterpart, at $74,436 versus $59,804, the extremely generous benefits with which they are also compensated boosts their real income margin by $26,632 over the average private sector income earner, putting their total compensation at $114,436 versus $87,804.

Keeping in mind that the average income of Americans in the private sector is considerably elevated by some very highly paid individuals such as CEOs, very specialized medical professionals, sports stars and entertainment moguls, the total compensation of U.S. federal government employees puts them all in a league of their own. And that's not even including their extreme job security.

Is it any wonder then that U.S. federal government employees are almost more likely to die than leave their jobs?

References

Asbury Park Press. Federal Employees, 2011. [Online Database]. Accessed 28 June 2013

Congressional Budget Office. Comparing the Compensation of Federal and Private-Sector Employees. [PDF Document]. January 2012

Previously on Political Calculations

Kamis, 06 Desember 2012

The Discovery of the Unseen

The planet Neptune has never been seen by anyone looking at the night sky through just their own eyes. So distant is it from the sun that the light it reflects toward the Earth is so faint that the planet is effectively invisible in the darkness of night. And yet, the outermost large planet of our solar system was discovered by astronomers who knew exactly where to look....

Following William Herschel's discovery of Uranus in 1781, the world's astronomers went to work to observe and describe the seventh planet of the solar system, taking detailed measurements of its trajectory in space.

Illustration of the Pull of a More Distant Planet Forty years later, French astronomer Alexis Bouvard published detailed tables describing Uranus' orbit about the sun. More than that however, his tables incorporated the lessons learned about planetary orbits from Johannes Kepler and Sir Isaac Newton to chart the path Uranus would follow into the future.

But then, something strange happened. Significant discrepancies between Bouvard's projected path for Uranus and its actual orbit began to be observed - irregularities that were not observed in the tables he had created to describe the orbital paths of the planets Jupiter and Saturn using the same methods. Soon, observations and detailed measurements confirmed that Uranus was moving along a path that was not described by Bouvard's careful calculations.

These irregularities led Bouvard to hypothesize that an as yet unseen eighth planet in the solar system might be responsible for what he and other astronomers were observing.

Voyager 2 Image of Neptune, emphasizing the 'Great Dark Spot' Over twenty years later, astronomer Urbain Le Verrier was working on the problem, taking a unique approach to resolving it.

What made Le Verrier's work unique is that he applied the math developed by Sir Isaac Newton to describe the gravitational attraction between two bodies to solve the problem. Here, he used Newton's theory to anticipate where an as yet unknown, but more distant planet also orbiting the sun would have to be to create the effects observed upon the position of the planet Uranus in its orbit.

Le Verrier completed his calculations regarding the position of the hypothetical eighth planet on 1 June 1846. A little over three months later, on 23 September 1846, the planet Neptune was observed for the first time at almost exactly the position in space where Le Verrier predicted it would be, confirming Newton's gravitational theory in the process.

We're going to do something similar today to explain why household income inequality in the United States has increased over time, even though there has been no change in individual income inequality.

From Darkness to Discovery

Our first chart below is based on data taken from the U.S. Census' data [Excel spreadsheet] on the inflation-adjusted median and mean income for all Americans from 1947 through 2010, which we've presented in terms of constant 2010 U.S. dollars. For reference, we've also indicated the NBER's official periods of recession in the U.S. during this period with the shaded red vertical bands on the chart:

U.S. Individuals Real Median Income with Recessions from 1947 through 2010

Next, we took the U.S. Census' breakdown of inflation-adjusted median income for both men and women for each of these years [Excel spreadsheet] and used the math that applies to log-normal distributions to construct the combined median income that applies to individuals. Our results are shown in the chart below, along with the actual median incomes reported by the U.S. Census so we can compare our calculated results with them:

U.S. Individuals Real Median Income by Sex with Recessions from 1947 through 2010

As you can see, our calculated results in creating a weighted median from the subsets of median income data for men and women are very close to the actual real median income numbers for all individuals. Here, because per capita income has been demonstrated to follow a log-normal distribution, we are able to use this math to either combine or extract subsets of data that have never been officially presented.

As an aside, we achieved the results above by treating the reported median income data the way we might calculate a weighted average. The beauty of the log-normal distribution math is that we can do this with medians, which we ordinarily could not do otherwise.

In the chart above, you can see the effect of the changing composition of the U.S. workforce, as the relative share of women earning incomes in the United States has increased since 1947. In 1947, the median income for individuals is much closer to the median income for men than it is for women. By 2010 however, we see that the median income for individuals is about halfway in between the median incomes for men and for women, reflecting that nearly equal share that both sexes now have among all individual income earners in the U.S.

Extracting The Unseen

The U.S. Census Bureau provides the median income data for individuals (or persons), men and women. It also reports median income data for both male and female wage or salary earners [Excel spreadsheet], whom we'll simply describe as Working Men and Working Women.

Using the math we demonstrated above with this data, we can extract the median incomes for two categories of people for whom the U.S. Census has never reported median incomes: men and women with incomes who do not earn wages or salaries, or as we'll describe them from now on, Non-Working Men and Non-Working Women! Today, we're putting what we found for all U.S. individual income earners together for the first time:

U.S. Individuals Real Median Income by Sex and Working Status with Recessions from 1947 through 2010

Constructing Households

Now, let's combine our median income earners into two-person households, pairing working men and women, working men and non-working women, non-working men and working women and finally non-working men and non-working women. We've shown our results below, along with the U.S. Census' official median income for U.S. households:

U.S. Couples Median Real Income with Recessions, 1947-2010

Well, look at that! The households formed by our single-wage and salary income earning couples from 1947 through 2010 closely parallels the actual real median income for U.S. households with a working man and non-working woman over that time (except for the years 1974 through 1977, where there seems to be an anomaly in the Census' data for working men - and here, the actual median splits the difference!) Also keeping in mind that the actual median household income might include the income contributions of additional people (say individuals between the ages of 16 and 24 who might be working part time at minimum wage jobs while also attending school and living at home with their parents), which likely accounts for the difference between the two, we've pretty much just demonstrated that we can successfully model basic U.S. households using just the data that applies for U.S. individuals.

But wait! What about single person households? Our next chart throws them into the mix as well!

U.S. Households Median Real Income with Recessions, 1947-2010

Using the figures for 2010, we approximated the income percentiles for each of our single and two-person median income earning households. The table below reveals our results (our model should put each approximated percentile within 0.2 of the actual percentile!):


Household Type 2010 Median Income Approximate Income Percentile
Working Men and Working Women $64,075 61.4
Working Men and Non-Working Women $50,026 50.7
Working Women and Non-Working Men $49,344 50.1
Non-Working Men and Women $35,295 36.7
Working Men Only $37,102 38.6
Working Women Only $26,973 27.7
Non-Working Men Only $22,371 22.4
Non-Working Women Only $12,924 11.5

It occurs to us that all we would need to increase the income inequality among households in the United States is to increase the nation's percentage of single person households among all households. That would work by increasing the number of households at the lower end of the income spectrum, even though it would have absolutely no effect upon the measured income inequality for individuals. The U.S. Census Bureau shows the change in the number of single person households since 1960:

U.S. Census Bureau: Percent of Single Person Households, 1960-2011

Here's the U.S. Census Bureau's Gini index measure of the amount of income equality among U.S. households for the years from 1947 through 2010:

Phil Wendt's Studio: Figure 1. Gini Index of Income Dispersion, 1947-2010

And here is the Gini index measure of the amount of income equality among U.S. individuals for the years from 1947 through 2005 (the data since 2005 is presented here - it's similar to all that recorded since 1960 in the chart below):

The relevant data in the chart above is the Gini measure indicated with the hollow circles, which is based on the "fine", or more detailed, income bins reported by the U.S. Census in its annual Current Population Survey. The other data in the chart, indicated by solid diamonds, represents income distribution data reported by the U.S. Census in larger, or more "coarse" income bins, which are less detailed and are therefore a much less accurate measure of the nation's level of income inequality in any given year.

Intersections and Connections

Looking at where all the data in these three charts intersect and overlap, What we find is that since 1960, the level of income inequality for U.S. individuals as measured by the "fine" Gini index is nearly constant, but has increased significantly for U.S. households. What has changed over that time is the composition of U.S. households, with a steady increase in the percentage of single person households.

Without a corresponding increase in the measured income inequality for U.S. individuals, the increase in the measured income inequality for U.S. households has been almost entirely driven by the increase in the number of single person households over time.

So income inequality among U.S. households isn't increasing because the rich are getting richer. That means that policies intended to right this situation by going after the rich in the name of "fairness" are guaranteed to fail, because the real cause of the increase in income inequality among U.S. households over time is something that cannot be fixed by such actions.

If only the people pushing such policies could see that....

And that concludes our eighth anniversary post. Thank you for joining us today - we greatly appreciate your choice to spend so much time with us (we really do try to draft shorter posts!)

Celebrating Political Calculations' Anniversary

Our anniversary posts typically represent the biggest ideas and celebration of the original work we develop here each year. Here are our landmark posts from previous years:

  • A Year's Worth of Tools (2005) - we celebrated our first anniversary by listing all the tools we created in our first year. There were just 48 back then. Today, there are nearly 300....

  • The S&P 500 At Your Fingertips (2006) - the most popular tool we've ever created, allowing users to calculate the rate of return for investments in the S&P 500, both with and without the effects of inflation, and with and without the reinvestment of dividends, between any two months since January 1871.

  • The Sun, In the Center (2007) - we identify the primary driver of stock prices and describe a whole new way to visualize where they're going (especially in periods of order!)

  • Acceleration, Amplification and Shifting Time (2008) - we apply elements of chaos theory to describe and predict how stock prices will change, even in periods of disorder.

  • The Trigger Point for Taxes (2009) - we work out both when, and by how much, U.S. politicians are likely to change the top U.S. income tax rate. Sadly, events in recent years have proven us right.

  • The Zero Deficit Line (2010) - a whole new way to find out how much federal government spending Americans can really afford and how much Americans cannot really afford!

  • Can Increasing the Minimum Wage Boost GDP? (2011) - using data for teens and young adults spanning 1994 and 2010, not only do we demonstrate that increasing the minimum wage fails to increase GDP, we demonstrate that it reduces employment and increases income inequality as well!

  • The Discovery of the Unseen (2012) - we go where so-called experts on income inequality fear to tread and reveal that U.S. household income inequality has increased over time mostly because more Americans live alone!

References

Kitov, Ivan. "Modeling the evolution of Gini coefficient for personal incomes in the USA between 1947 and 2005," MPRA Paper 2798, University Library of Munich, Germany. 2007.

Lopez, J Humberto and Servén, Luis. "A Normal Relationship? Poverty, Growth and Inequality". World Bank Policy Research Working Paper 3814, 2006.

Pinkovskiy, Maxim and Sala-i-Martin, Xavier. "Parametric Estimations of the World Distribution of Income". NBER Working Paper No. 15433. October 2009.

Political Calculations. The Distribution of Income for 2010: Households. 14 September 2011.

U.S. Census Bureau. Changing American Households. [PDF document]. C-SPAN. 4 November 2011. p. 6.

U.S. Census Bureau. Table P-2. Race and Hispanic Origin of People by Median Income and Sex: 1947 to 2010. [Excel spreadsheet]. September 2011.

U.S. Census Bureau. Table P-4. Race and Hispanic Origin of People (Both Sexes Combined) by Median and Mean Income: 1947 to 2010. [Excel spreadsheet]. September 2011.

U.S. Census Bureau. Table P-53. Wage or Salary Workers (All) by Median Wage and Salary Income and Sex: 1947 to 2010. [Excel spreadsheet]. September 2011.

Wendt, Phil. Income Disparity by the Numbers. Phil Wendt's Studio. 26 December 2011.

Kamis, 20 September 2012

Visualizing Income Inequality Since 1994

How is income inequality changing over time?

To find out, we've updated our chart showing the trends we find for U.S. individuals, families and households according to their Gini Coefficient as recorded by the U.S. Census since 1994 in the Annual Social and Economic Supplement it provides for its Current Population Survey, where a value of 0 indicates perfect equality (everyone has the same income) and a value of 1 indicates perfect inequality (one person has all the income, while everyone else has none):

U.S. Income Inequality for Individuals, Families and Households, 1994 to 2011

Why only from 1994? That's because the Census only began publishing its data online in an easy to access electronic format after 1993 (note the left hand margin here). The Census has published its older data online, but in the form of scanned documents that require a lot of manual effort to extract the data, which is also not as detailed as the newer versions.

Besides, it's not like the data since 1994 doesn't show the key trends for income inequality in the United States! Going to our chart, here is what we find:

  • The level of income inequality for individuals is essentially unchanged over time, holding flat within a fairly narrow range.

  • Once we begin combining individuals into families, we see a rising trend in income inequality over time.

  • Likewise, once we combine individuals into households, we also see a rising trend in income inequality over time.

Since income is predominantly earned by individuals (note that your paycheck is made out to you, not your spouse, roommate, parents or children), the only way these patterns can exist is if high income earning individuals are increasingly combining together over time to form families and households, or as is more likely the case, low income earning individuals are becoming less and less successful in forming families and households.

To see what we mean, here are the median incomes for individuals, households and families:

  • Individuals: $26,588

  • Households: $50,054

  • Families: $60,974

Note that the median income for families is more than twice that for individuals. That indicates that high income earners are indeed combining together to form these social units more often than low income earners.

Now, going back to the apparently unchanging level of income inequality over time for individuals, the only meaningful conclusion from data that can only be driven by economic, rather than social, factors. Russian physicist Ivan Kitov did the heavy lifting in calculating the population distribution functions that apply for the Personal Income Distribution (PID) in the United States. Here's what he found in looking at the same data since 1994:

Figure 4 depicts the population density functions, PDFs, for the years between 1994 and 2010. First, the estimates presented in Figure 1 were normalized to the total population for a given year. Then we reduced the income scale for individual years, i.e. from 1995 to 2010, by the total growth of real GDP. This allows normalizing the curves to the total income, i.e. we reduce all scales to that of 1994. Finally, we normalize the portions of populations in given bins to their widths for individual years and obtain the population density functions. Figure 4 proves that the distribution of personal incomes has not been changing over time in relative terms, i.e. a given portion of population always has a given portion of total income.

Some might say that the Census' data doesn't provide a full picture of the income distribution in the U.S., preferring instead to point to the IRS data for tax collections, which includes the effect of capital gains (much of which may be traced to once-in-a-lifetime events.)

As it happens, Kitov has examined that data too, going back to 1996 (when the IRS began reporting its statistics of income online):

Let’s take a look the data they used to prove the increasing inequality. The IRS measured incomes are usually referred to. Without loss of generality, we have retried “Table 1.1 Selected Income and Tax Items, by Size and Accumulated Size of Adjusted Gross Income, Tax Year 2009”. (Any other year between 1996 and 2009 is good as well.) This Table lists individual incomes in various income bins from $1 to $10,000,000. There are also 8274 reports of income above $10,000,000. We cannot use the latter incomes but definitely can plot the population density function for all incomes below $10,000,000. Figure 2 depicts the whole PID and Figure 3 its high income portion. The higher incomes are well approximated by a power low with an exponent of -3.07. (The difference of ~1.0 from the exponent for the BLS PDF (-4.1) is completely explained by the normalization to the total personal income reported by the BLS. It means that both exponents are identical.) It is likely that the same power law is valid at incomes higher than $10,000,000. Hence, there is no significant deviation (except measurement errors) from the Pareto distribution even at very high incomes and our extrapolation of the BLS incomes along the power law is valid for the calculations of Gini coefficients.

Conclusion: there is no growth in income inequality. Krugman et al. definitely exaggerate. As a Russian physicist, I have no political or any other emotional prejudice to the income distribution in the USA. I just calculate it.

Different data sets measuring the income distribution in the U.S., competent (and solid) analysis, same conclusion: there has been no meaningful change in the income inequality found among individuals for nearly the last two decades. The increase in the income inequality found for families and households over that time is the result of social, rather than economic, factors.

Selasa, 07 Februari 2012

The Continuing Adventures of an Incredibly Incurious Journalist

It seems the Incredibly Incurious Journalist Jonathan Chait has decided to double down. Picking up the story from where we make our appearance in Jonathan's cloistered world:


Likewise, the blog Political Calculations — whose work Pethokoukis has cited as refuting the “myth” of income inequality — is unhappy as well. My post pointed out that its supposed refutation of rising inequality is erroneous, because it relies on census data. The Census Department does not collect detailed information about rich people’s income, which is why inequality researchers look elsewhere when they want to study changing income among the very rich. Lane Kenworthy, an actual expert in this topic, helpfully explained the folly of the Political Calculations chart. I thought his explanation was too detailed to be of interest to readers here, but since they’re complaining, I’ll reprint a longer excerpt of his e-mail to me:


You know, it *still* hasn't occurred to the Incredibly Incurious Journalist Jonathan Chait that perhaps, just perhaps, questions about our work should be directed to us, as he has *still* made no apparent effort to contact us with any such questions! (We've even checked our e-mail spam filter!)


Although he isn't doing anything more than regurgitating the contents of an e-mail he received from an individual he has proclaimed to be an "actual expert", let's see what we can learn from it. Better yet, let's also see if we can do what appears to be beyond Jonathan Chait: ask questions about the information he is accepting at face value! From the e-mail of Chait's "actual expert" Lane Kenworthy:


Over the period since 1994 the Census Bureau's standard Ginis for households and for families, which are the ones used in the Political Calculations chart, suggest little or no change in income inequality. So too do Ginis for earnings inequality among full-time year-round employed individuals (see IE-2 at http://www.census.gov/hhes/www/income/data/historical/inequality/index.html).


We're mostly off on a good footing so far - Chait's "actual expert" appears to have checked our source data to confirm that our chart is accurately reflecting the Census' data for families and households, and he's added some new information: the earnings inequality data for full-time, year-round employed individuals also shows little-to-no change. Although we used the data for "All Persons", rather than "Full-Time, Year-Round Employed Individuals", we would expect these different data sets to be similar.


But it's well-known that the Census Bureau data miss what's going on at the top, because they "top code" very high earnings and incomes. What the Census data tell us, and what the Political Calculations post in effect simply reiterates, is that within the bottom 99% there has been little change in income inequality since 1994, whether we're looking at households, families, or individuals.


This is where it really begins to go a bit south for Chait's "actual expert" Lane Kenworthy. Now, we were pretty up front in our previous post on the topic that yes, the Census' reported data is "top-coded", which is "Census-speak" for the situation where all those with total money income above a certain threshold are lumped together into a single grouping that doesn't identify specifically what each makes, so yes, we're pretty sure we're aware of the practice.


But there are two key things that Chait's "actual expert" Lane Kenworthy has missed here: the minimum income threshold to qualify as being in the Top 1% for Families, Households and Individuals and also the level of income at which the Census actually "top-codes" its data for each!


The omission might lead one to think that Chait's "actual expert" actually thinks that the Census' income data is only valid for the "bottom 99%". That somehow, the possibility that the Census' income data might significantly overlap the entire annual incomes earned by a large number of individuals, families and households in the "Top 1%" for each category has escaped him. As does the possibility that these numbers might in fact be large enough to constitute a large enough statistical sample of the "Top 1%" that we can indeed make valid assessments of the overall actual trends in income inequality using just the Census' data.


A curious journalist might ask:


"How many of the Top 1%'s total money income is fully contained within the Census' data before it hits the actual income level where it has been 'top-coded'?"


Alas, the Incredibly Incurious Jonathan Chait is not such a journalist....


We can ask "Why begin in 1994?"


Hey, a curious journalist might have asked us the same question. We even know the answer!


But the bigger problem is ignoring what happened at the top of the distribution.


During this particular period, income inequality increased due to the top pulling away from the rest. According to the Census Bureau's calculations for households, there was essentially no change in inequality from 1994 (Gini .456) to 2007 (Gini .463). (Again, these are the data for households used in the Political Calculations chart.)


That's strange - we would describe a change in the Gini value from 0.456 to 0.463 as an "increase". In fact, we did, but more on that later....


Check this out now - our chart runs from 1994 through 2010 (as it happens, these are all the years for which the Census has made the data for families, households *and* individuals easily accessible on its own web site in a web-friendly format that anyone can access to confirm that the data we presented was correct - see, we really did know the answer to the question of "Why begin in 1994?"!).


But for some strange reason, Chait's "actual expert" decided to stop the income inequality clock at 2007. A curious journalist might ask:


"Did something happen after 2007 that might affect the income inequality numbers that the 'expert' doesn't seem to want to talk about?"


or...


"Should I really trust an 'actual expert' who's clearly using a cherry-picked set of data to make their 'expert' claim?"


Alas, the Incredibly Incurious Jonathan Chait is not such a journalist....


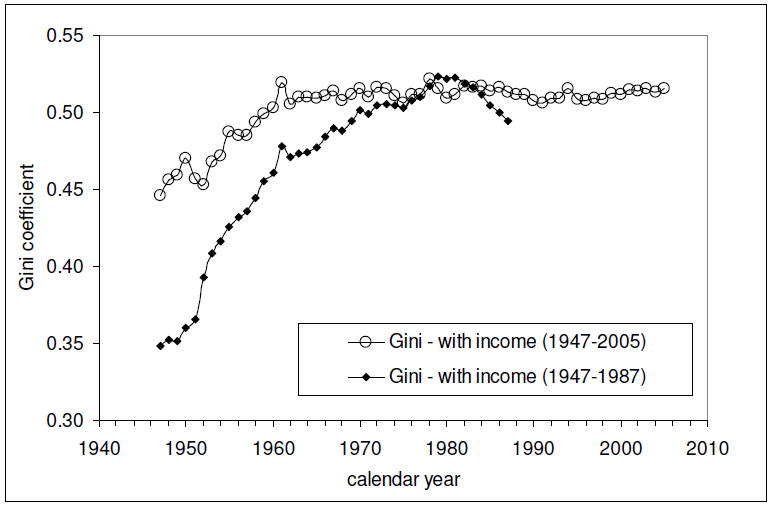
The best source of income data for households is the CBO, which merges the Census household survey data with IRS tax record data. According to the report the CBO put out a few weeks ago, household income inequality including the top 1% actually increased sharply between 1994 and 2007. The CBO report is at http://www.cbo.gov/doc.cfm?index=12485; see Figure 11 on p. 20; the closest CBO counterpart to the Census income measure is "market income plus transfers". Eyeballing the CBO chart, it looks to me like the Gini goes from .45 in 1994 to about .52 in 2007. That's a large increase.


It's all fine and dandy to compare the results of the equivalent households from the CBO's study to the households of the Census to get a sense of how different they might be from one another with one adding in data not present in the other. In this case, much of that additional data covers an especially volatile component of income that can represent a large portion of the annual earnings of high income earners.


For our purposes, what Chait's "actual expert" Lane Kenworthy has accomplished here is to confirm that the Census data for households shows an increase in the measured income inequality of households from 1994 through 2010 and that the CBO's data, which includes that additional volatile income component that is not fully captured by the Census data, shows a larger magnitude increase, which is really what anyone should expect. Seeing as we made no claim to the contrary with respect to *household* data, our official position is "Yes, and...?"


A curious journalist, or even an "actual expert", might then ask:


"What results did the CBO obtain for individuals and how did they compare to the CBO's results for households?"


Or for that matter:

"What results did the CBO obtain for individuals and how did they compare to the Census' results for individuals?"


After all, the whole point of Political Calculations' original analysis is to compare the respective income inequality trends over time for Families, Households *and* Individuals. Because the Census' data for each was collected simultaneously, through identical methods and handled by the Census throughout its analysis using consistent methods, top-coded or not, the trends for each over time may be directly compared to one another, with valid conclusions being able to be drawn from an analysis of those trends.


Doing that, we observed that the Gini coefficient for both Families and Households increased from 1994 through 2010, but that this measure of income inequality for Individuals was flat, or even slightly fell, over this time. That observation indicates that things other than economic factors are responsible for the observed increases in the measured income inequality of both Families and Households, because if economic factors were involved, the same kind of increase in measured income inequality would have been observed in the data for Individuals.


Other than almost confirming that we accurately represented the data recorded by the Census for Individuals (remember, he looked at "full-time, year-round income earners rather than "all persons"), Chait's "actual expert" has avoided any discussion of that particular data, obsessing instead over the data for Households.


That's useful for us up to a point, given that Chait's "actual expert" has confirmed that the Census data is indeed picking up on the same general increasing trend that exists when the CBO's additional volatile income component is factored into a separate analysis. At least with Census household data and what the "expert" has identified as being the nearest equivalent measure to that in the CBO's analysis.


But Chait's "actual expert" is awfully silent regarding the trends for income earned by Individuals - the foundational component of both Families and Households. It is as if Chait's "actual expert" lacks the actual expertise to offer any comment in this area.


The only question remaining then, which might be asked by a curious journalist or even by an "actual expert", is:

"If the data to produce such an analysis for the trend in income inequality for Individuals exists, why hasn't it been produced?


It's not like that analysis can't be done. You would think that someone who has been proclaimed by a journalist to be an "actual expert" on income inequality would be capable of doing that themselves. After all, the CBO used the Census' income data as a foundation upon which it grafted IRS data to produce its "equivalent-to-Census households" results. It would be odd that they wouldn't be able to do the same thing with the data for Individuals, even if other "actual experts" cannot bring themselves to do it.


Pethokoukis triumphantly concludes, "Chait's theory of the case has come apart." In fact, "Chait's theory of the case" also happens to be the consensus view of every expert who actually studied the issue and knows which data to examine.


Seeing as the "experts" upon whom the Incredibly Incurious Journalist Jonathan Chait relies for his theories apparently don't have their act together in this area, otherwise we would already have the answers to each of the questions above, Chait's proclaimed "consensus" among them perhaps isn't all it's cracked up to be. Remember, these are the same people to whom it apparently never occurred to compare the income inequality trends over time for Families, Households *and* Individuals.


Maybe if somebody were actually curious enough to start asking them the right questions....


Alas, the Incredibly Incurious Jonathan Chait is not such a journalist!

Rabu, 01 Februari 2012

The Incredibly Incurious Journalism of Jonathan Chait

What are we to make of journalist, editor and author Jonathan Chait's New York Magazine article "Inequality and the Charles Murray Dodge"?


Here's the particular passage we have in mind as we ask that question:


A more blunt version of this technique was previewed a couple months ago by the American Enterprise Institute’s James Pethokoukis, perhaps the right’s most enthusiastic inequality denier. Pethokoukis cited a chart, compiled by Political Calculations, purporting to show that the only change in inequality results from changed family status. Pethokoukis triumphantly presented this as the “The one chart that explodes the myth of U.S. income inequality,” and used it to segue, as Brooks does today, to Murray’s arguments about family values:


So what we have here, as always in America it seems, is culture trumping economics (though the data don’t take into account how different income groups have different inflation rates, another equalizer). AEI’s Charles Murray has a new book coming out that will expand on how values and culture influence inequality.


But the chart is completely wrong. Reader Jacques Distler pointed out to me that it relies on census data, which only asks households if they earn more than $100,000 a year. Since all the change in income inequality has come within households earning well over that mark, the census data is not going to capture the rise in income inequality. (Think of it this way. Imagine you want to show that basketball centers get taller as you move from high school to college to the NBA. If your tallest category is "six foot two and over,” you’re not going to show much of an effect.)


I e-mailed Lane Kenworthy, an inequality expert, who confirmed this for me. Inequality between the top one percent and everybody else has increased dramatically.


You know, it occurs to us that there are at least three individuals or entities who could have been contacted, but who weren't consulted at all before the assembling of these paragraphs:


  1. Us

  2. James Pethokoukis

  3. The U.S. Census Bureau


Because, if we had been contacted, we could have easily confirmed that while the Current Population Survey that is used to collect income data is indeed sent to households, it collects data for persons and families, in addition to households! It also doesn't limit those who are sent surveys to placing themselves into a "$100,000 or more" category. The individuals who participate in the survey report the amount of their income from all sources.


One important thing to note about the U.S. Census Bureau's reports is that the agency does indeed "top code" its reported income range categories, grouping the people at the very top end of the income spectrum into one income range in its reports. It does this largely for the sake of preserving the confidentiality of those in that topmost range. Otherwise, given how few people there are at those levels, it would be very easy to identify who is who based upon the information they might provide to the Census through the income survey.


And what's more, although the Census reports the Gini Coefficient, a very common and widely accepted measure of income inequality, in a standard table that groups top-end income earners into the category "100,000 and over", its calculation of the Gini Coefficient it reports for persons, families and households uses all the data it collects for persons, families and households respectively.


Better yet, the Census publishes another income distribution table for persons that goes all the way up to the topmost category of "$250,000 or more", breaking it down for both Men and Women (and by race too, if you're really into that sort of thing). In fact, we're very familiar with this data because we used the data for women for a more fun project.


That's significant because individuals with incomes of $250,000 or larger represent the "Top 0.6%" in 2010, so even the data the Census reports extends well up into the territory of the "Top 1%". That means we can indeed use the Census' data to make assessments of how income inequality for individuals is changing over time, because these are the people whom Jonathan Chait feels is most important for making such a determination!


Not that we need to go to that trouble anyway - if you want to see increasing income inequality, you can see it at the bottom of the income spectrum as well.


It seems then that relying upon "Reader Jacques Distler" for a technical assessment of the Census' data collection processes, analysis and reporting procedures isn't looking like too sharp a move on Jonathan Chait's part - he clearly didn't know any of this stuff. Perhaps if Chait had thought to actually direct questions to people who actually work with the data he could have found that out sooner, but he just wasn't curious enough! What a strange trait in a "journalist"!


As for Lane Kenworthy, inequality expert, it seems that Chait wasn't curious enough to ask him about the Census' actual data collection, handling and reporting practices, choosing instead to get some confirmation of what would the results be "if" data were collected and handled in the way he describes.


At this writing, we see that Chait's article on the New York Magazine web site has attracted some 70 comments since it was posted at 3:11 PM (Eastern Standard Time). We first became aware of it when one visitor, some four hours later, was curious enough to follow the link Chait provided to our site.


In the last three hours before we posted this article, no one appears to have been curious enough to click through to our site from the link provided Chait's article (could that be a shared characteristic of both Chait and his readers?) We would almost bet at this point that this post will drive more traffic to Chait's article than vice-versa!


You know, it occurs to us that we could have alternatively titled this post "The Incredibly Lazy Journalism of Jonathan Chait" and have still been right on the money.

Selasa, 03 Januari 2012

Median Adjusted Gross Incomes by Tax Filling Status

Sometimes, as we work on our various projects, we stumble across data that's kind of interesting in and of itself.


To that end, today's example of that would appear to provide more evidence that social factors have more to do with the perceived rise in income inequality in the United States over time than do economic factors:


Median Adjusted Gross Incomes by 2009 Tax Filing Status

In the chart above, we've presented the median adjusted gross incomes we've estimated for 2009's income tax filers according to their tax filing status. The number in parentheses below each column in the chart indicates the number of tax returns filed in 2009 for each group.


It would seem that just marital status has a lot to do with the observed differences between the various kinds of income tax filers.


Data Source


U.S. Internal Revenue Service Statistics of Income Division. 2009 Individual Complete Report (Publication 1304), Table 1.2. [Excel Spreadsheet]. Accessed 2 January 2012.

Selasa, 06 Desember 2011

Can Increasing the Minimum Wage Boost GDP?

Does increasing the minimum wage increase GDP?


Bloggingstocks' Joseph Lazaro outlined the theory that it might back on 1 August 2009, shortly after the U.S. federal minimum wage reached its current level of $7.25 per hour (emphasis ours):


... the U.S. Federal Reserve will be monitoring prices and costs to see if the higher minimum wage is creating inflation havoc at a time when U.S. businesses least need another concern to deal with. Businesses have enough to worry about; and some are struggling just to maintain operations for another quarter or two -- the recession has been that damaging.


But the Fed will also be looking for signs of another side-effect, and this one is a positive one: a GDP boost. That's because millions of workers are going to get a raise that they otherwise would not have gotten, and that will increase their purchasing power.


The significance? Some of those increased-pay workers will choose to spend -- perhaps buying a washer or drier, making a down payment on a used car, or paying down a debt. It's quite possible -- although in these "frugal consumer" economic times no one is certain- - that the wage hike will increase U.S. GDP, serving as a small engine of growth as the U.S. economy inches back toward health.


It's an intriguing possibility isn't it? But has it worked out that way?


One way we can find out if boosting the federal minimum wage has boosted GDP is by examining the economic fortunes of the people most likely to be earning minimum wages in the United States: teenagers and young adults!


Together, individuals between the ages of 15 and 24 have consistently made up approximately one half of all minimum wage earners, so we should be able to use the personal income data the U.S. Census has collected and published for this age group for each year since 1994.


Age 15-24 Population and Total With Incomes, 1994-2010

First, let's consider the population of 15-24 year olds in the United States, and the number of those individuals counted as having income from 1994 through 2010.


Over this time, the federal minimum wage has increased from $4.25 per hour in 1994, to $4.75 in 1996 and then 50 $5.15 per hour in 1997, where it held level until 2007. Beginning in 2007, it was increased by 70 cents per hour once a year up until it reached its current level of $7.25 per hour in 2009.


What we see however is that the number of teens and young adults with incomes has fallen over time. Our next chart shows the percentage of Americans between the ages of 15 and 24 who were counted as having income in the U.S. Census' Current Population Survey for each year from 1994 through 2010.


Age 15-24 Percent of Population With Incomes, 1994-2010

In this chart, we find that the percentage of teens and young adults who had incomes peaked in 1995, with 75.3% of the entire Age 15-24 population counted as having earned income in that year, which has since fallen to 59.9% as of 2010.


So far, both these charts indicate that the number of teens and young adults in the U.S. workforce has fallen from 1995 through 2010 - these charts don't tell us anything about how teens and young adults might have benefited from higher pay obtained through a rising minimum wage over time!


For that, we'll dig deeper in the U.S. Census' data and extract the data for the aggregate amount of income earned by individuals Age 15-24. Since one way of measuring the U.S. Gross Domestic Product is to add up all the income earned by people in the United States, we can use the Census' estimate of the aggregate income earned by U.S. teens and young adults to represent their contribution to the U.S.' GDP.


The easiest way to do that is to compare the amount of income earned by all U.S. teens and young adults in 1995, when the percent share of teens in the U.S. workforce peaked with the total amount of income earned by all U.S. teens and young adults in 2010, the most recent year for which we have data.


Nominal and Real Aggregate Income for Individuals Age 15-24, 1995 and 2010

Coincidentally, selecting these particular years for comparision works especially well for our purposes, since it spans the increases in the U.S. minimum wage from $4.25 per hour to $7.25 per hour, with 1995 being one year before the first minimum wage increase in our period of interest occurred, and 2010 being one year after the most recent increase in the U.S. minimum wage took place.


We'll also adjust the numbers to account for the effect of inflation, using an animated chart to show the results.


What we find in examining this chart is that for the 15 year span from 1995 to 2010, the nominal aggregate income of U.S. teens and young adults increased by 14.75%, from roughly $302.9 billion to $347.5 billion.


But most remarkably, in terms of constant 2010 U.S. dollars, the aggregate income of U.S. teens and young adults fell by 0.56% from $349.5 billion in 1995 to $347.5 billion in 2010. For all practical purposes, despite a 70.6% increase in the nominal value of the U.S. federal minimum wage from $4.25 to $7.25 (a 21.8% increase in real terms), the total amount of income collectively earned by the predominant earners of the U.S. minimum wage in the United States is unchanged.


Total Money Income Distribution for Individuals Age 15-24, 1995 and 2010

Let's take a step backwards and consider the nominal income distribution of teens and young adults in both 1995 and 2010 in nominal terms.


Our next animated chart shows how many thousands of Age 15-24 individuals the U.S. Census counted within each $2,500 increment of total money income in both 1995 and 2010.


Here, we find that the distribution of income has shifted primarily at the lower end of the income spectrum. Our final chart quantifies the changes for each of the U.S. Census' measured income increments.


Here, we note that an individual earning the U.S. federal minimum wage of $7.25 per hour in 2010 who works full time (2,080 hours per year = 8 hours a day, 5 days per week, 52 weeks per year), would earn $15,080 in a year. That puts all the income affected by increases in the U.S. federal minimum wage over time below this level.


Change in Number of Age 15-24 Total Money Income Earners from 1995 through 2010

What we find is that this income range at the lowest end of the income spectrum for Americans between the ages of 15 and 24 is the only income range where there have been reductions in the number of individuals with incomes between 1995 and 2010.


We also find that the number of individuals with incomes below $15,000 has fallen by 5,045,000 from 1995 to 2010. Meanwhile, we find that the number of Age 15-24 individuals with incomes over $15,000, which would be considered to be largely unaffected by increases in the U.S. federal minimum wage over time, has increased by 3,105,000.


Overall, there are 1,940,000 fewer individuals between the ages of 15 and 24 with incomes in 2010 than in 1995.


Consequently, we find that increasing the federal minimum wage has failed to increase GDP over time. Worse, we find that increasing the federal minimum wage has actually increased income inequality within the Age 15-24 population from 1995 through 2010, as the same aggregate income, when adjusted for inflation, is effectively being spread among nearly two million fewer people.


Returning to Joseph Lazzaro's thoughts on the topic:


... if the Fed and other organizations can verify that the minimum wage increase has boosted GDP without a loss of jobs, or inflation, Congress may to consider another decision in the quarters ahead: a decision to raise the federal minimum wage again, this time to $8.25 per hour.


In our view, the only reason the U.S. Congress would choose to increase the federal minimum wage again would be to ensure the onset of a new recession.


This concludes our annual anniversary post, where we celebrate the biggest ideas we've developed during the past year! This year's anniversary post was a bit unique in that it combines two of the areas in which we've made a mark (or left one!): the real impact of minimum wages on the U.S. teen population and the real nature of income inequality in the United States.


As for the biggest ideas we've developed in previous years, here's the list:


  • 2005: A Year's Worth of Tools - we celebrated our first anniversary by listing all the tools we created in our first year. There were just 48 back then. Today, there are over 259....

  • 2006: The S&P 500 At Your Fingertips - the most popular tool we've ever created, allowing users to calculate the rate of return for investments in the S&P 500, both with and without the effects of inflation, and with and without the reinvestment of dividends, between any two months since January 1871.

  • 2007: The Sun, In the Center - we identify the primary driver of stock prices and describe a whole new way to visualize where they're going (especially in periods of order!)

  • 2008: Acceleration, Amplification and Shifting Time - we apply elements of chaos theory to describe and predict how stock prices will change, even in periods of disorder.

  • 2009: The Trigger Point for Taxes - we work out both when, and by how much, U.S. politicians are likely to change the top U.S. income tax rate.

  • 2010: The Zero Deficit Line - a whole new way to find out how much federal government spending Americans can really afford!


Thank you for joining us for our anniversary! We appreciate that there are a lot of ways you can choose to spend your time, and we greatly appreciate your willingness to share so much of it with us over the past year.

Selasa, 15 November 2011

Income Inequality by Age Group in 2010

Which age group in the U.S. has the greatest amount of income inequality among its members? The choices are:


  1. Age 15-24

  2. Age 25-34

  3. Age 35-44

  4. Age 45-54

  5. Age 55-64

  6. Age 65-74

  7. Age 75 and older


We won't keep you in suspense - the chart below reveals the answer!


Income Inequality Within Various Age Groups, 2010

Are you surprised to see that teens and young adults between that ages of 15 and 24 have the greatest amount of income inequality, as measured by the Gini Coefficient?


If it helps understand why, consider that this age group really represents the point at which Americans enter into their first jobs. It covers everyone from those who haven't graduated from high school, but are working in part-time, minimum wage level jobs on up through recent college graduates in difficult, high paying disciplines like petroleum engineering.


Meanwhile, we see that the level of income inequality drops dramatically for adults between the ages of 25 and 34, which corresponds to individuals who have fully entered into their careers. The amount of income inequality by age group then increases through Age 65-74.


Relative Earnings Trajectories by Level of Educational Attainment After Age 18-24

To a large extent, what you're seeing here is the effect of education level upon the lifetime earnings of individuals, where those with higher levels of education tend to have greater income growth over time.


But that doesn't explain it all. Most individuals hit their peak earning years in their mid-to-late 40s, which wouldn't explain why income inequality continues to increase for older individuals.


Here, we need to consider the role of investment income. Assuming that the most successful income earners also consistently save or invest a portion of their income over time, if they realize positive rates of return, they can continue boosting their income above and beyond what they earn through wages and salaries.


That's a big reason why we see that individuals Age 65-74 have the second greatest amount of income inequality by age group - the most successful individuals are benefiting from a lifetime of saving and investing, while others within this age group earn much lower amounts of income, or none, through investing.


We next see that income inequality falls dramatically from Age 65-74 to Age 75 and older. This drop largely corresponds to the depletion of retirement savings that individuals set aside during their working years, which reduces the amount of income they might receive from the reduced principal they have invested.


Meanwhile, for this age group, individuals who were less successful in establishing retirement savings benefit from government income transfer programs like Social Security, which provides disproportionately large benefits to the people who earned the lowest incomes during their working years.


We'll close by sharing Payscale.com's chart showing the typical incomes earned by individuals just graduating college with degrees in the top-paying fields of 2011:


DegreesDegrees
Methodology
Annual pay for Bachelors graduates without higher degrees. Typical starting graduates have 2 years of experience; mid-career have 15 years. See full methodology for more.


Data Source


U.S. Census. Current Population Survey. Annual Social and Economic Supplement. Table PINC-01. Selected Characteristics of People 15 Years Old and Over by Total Money Income in 2010, Work Experience in 2010, Race, Hispanic Origin and Sex. Accessed 13 November 2011.