Tampilkan postingan dengan label income. Tampilkan semua postingan

Jumat, 20 September 2013

What Is Your U.S. Income Percentile Ranking?

Woman posed with stack of packages of $1 silver certificates at the Bureau of Engraving and Printing, Washington, D.C. [between ca. 1950 and ca. 1969] Source - loc.gov/rr/business/money/paper.html

Where do you stack up in the distribution of income within the United States?

We can help you answer this question using the data that the U.S. Census Bureau has collected on the total money income earned by individual Americans, as well as for the families and households into which Americans gather themselves!

If you're a visual person, we'll first present the information graphically in chart form and then we'll present a tool where you can get a more precise estimate of what your percentile ranking is within each of these groups. In the charts below, first find the income that applies for you on the horizontal axis, then move directly upward to the curve that defines the cumulative distribution of income. Once you've found your place on S-shaped curve in each chart, look directly to the vertical scale on the left hand side of the chart to determine your approximate U.S. income percentile ranking.

The first chart applies for individual Americans, which includes all people Age 15 or older who received some kind of money income on a regular basis, say from full-time jobs or Social Security benefits, but not for things like food stamps, health benefits, housing assistance, capital gains, etc.. With that being the case, the Census Bureau's data tends to understate the amount of effective income that Americans have, especially at the lower end of the income spectrum:

Cumulative Distribution of Income for U.S. Individuals, 2012

Our second chart shows how the distribution of income changes when individual Americans are grouped into families, which the Census Bureau defines as being a "group of two people or more (one of whom is the householder) related by birth, marriage, or adoption and residing together":

Cumulative Distribution of Income for U.S. Families, 2012

Our third chart is similar to the families chart, but here, individual Americans have been grouped into households. Households are different from families in that they consist of "all the people who occupy a housing unit", regardless of whether they are related to each other by birth, marriage or adoption, or not, and even a single individual who lives alone is considered to be a distinct household.

Cumulative Distribution of Income for U.S. Households, 2012

So much for the pictures - let's see where you really fit in! To find out where you, your family or your household ranks among each of these categories, just enter your personal income, your family's income, which includes the incomes of your spouse and other family members who live with yout, and also the combined income of just the people who live within the walls of the same household that you do. We'll do some quick math and provide a more precise estimate of the percentage of all American individuals, families and households that you outrank given the incomes you enter.

And as a bonus, we'll also break down the numbers for your Individual income to tell you how you compare to your fellow male and female Americans.

It all starts below! (Unless you're accessing this article through a site that simply republishes our RSS news feed, in which case, you should click through to our site to access a working version of our tool....)


Income Data
Input Data Values
Select Year of Interest
Your Personal Total Money Income
Your Family's Combined Total Money Income
Your Household's Combined Total Money Income


Your Estimated U.S. Income Percentile Ranking
Calculated Results Values
Among All U.S. Individuals with Incomes
 - Among All U.S. Men with Incomes
 - Among All U.S. Women with Incomes
Among All U.S. Families
Among All U.S. Households

For our readers who live outside of the United States, you can still get in on the action if you convert your income from your local currency into U.S. dollars first!

Notes

The default data we've presented in the tool above represents the average total money income of U.S. individuals, families and households for the year you select. Oh, and as a bonus, you can also see where you would have fit in the U.S. income distributions we've modeled going back to 2011 by selecting your year of interest (other years may appear in the future!...)

In the tool above, your percentile ranking indicates the percentage of Americans who either share your income or earn less than you do. As such, it tells you what percentage of the population you're above in the income-earning food chain.

For example, a percentile ranking of zero would indicate that you are at the very bottom end of the American income spectrum, while a percentile ranking of 100 indicates that you are effectively at the very top end. A percentile rank of 50.0 would indicate that you're within spitting range of being the middle of all Americans, as our tool should be able to place most people within 0.2% of their actual percentile ranking.

Finally, if you're looking for the income data for this year, please note that the U.S. Census Bureau will report the data it collects for this year sometime in September of next year. The delay isn't all bureaucratic - they send out the surveys for income in March of each year, just as or after most Americans fill out their income taxes for the previous year so their income figures are still fresh in their memories, and then it can take the Census Bureau's statisticians up to six months to sort it all out and make some kind of coherent sense of it all!

References for 2012 Incomes

U.S. Census Bureau. Current Population Survey. Annual Social and Economic (ASEC) Supplement.Table PINC-01. Selected Characteristics of People 15 Years and Over, by Total Money Income in 2012, Work Experience in 2012, Race, Hispanic Origin, and Sex. [Excel Spreadsheet]. 17 September 2013. Accessed 17 September 2013.

U.S. Census Bureau. Current Population Survey. Annual Social and Economic (ASEC) Supplement.Table PINC-11. Income Distribution to $250,000 or More for Males and Females: 2012. Male. [Excel Spreadsheet]. 17 September 2013. Accessed 17 September 2013.

U.S. Census Bureau. Current Population Survey. Annual Social and Economic (ASEC) Supplement.Table PINC-11. Income Distribution to $250,000 or More for Males and Females: 2012. Female. [Excel Spreadsheet]. 17 September 2013. Accessed 17 September 2013.

U.S. Census Bureau. Current Population Survey. Annual Social and Economic (ASEC) Supplement.Table FINC-07. Income Distribution to $250,000 or More for Families: 2012. [Excel Spreadsheet]. 17 September 2013. Accessed 17 September 2013.

U.S. Census Bureau. Current Population Survey. Annual Social and Economic (ASEC) Supplement.Table FINC-01. Selected Characteristics of Families by Total Money Income in: 2012. [Excel Spreadsheet]. 17 September 2013. Accessed 17 September 2013.

U.S. Census Bureau. Current Population Survey. Annual Social and Economic (ASEC) Supplement.Table HINC-06. Income Distribution to $250,000 or More for Households: 2012. [Excel Spreadsheet]. 17 September 2013. Accessed 17 September 2013.

U.S. Census Bureau. Current Population Survey. Annual Social and Economic (ASEC) Supplement.Table HINC-01. Selected Characteristics of Households by Total Money Income in: 2012. [Excel Spreadsheet]. 17 September 2013. Accessed 17 September 2013.


Kamis, 06 Desember 2012

The Discovery of the Unseen

The planet Neptune has never been seen by anyone looking at the night sky through just their own eyes. So distant is it from the sun that the light it reflects toward the Earth is so faint that the planet is effectively invisible in the darkness of night. And yet, the outermost large planet of our solar system was discovered by astronomers who knew exactly where to look....

Following William Herschel's discovery of Uranus in 1781, the world's astronomers went to work to observe and describe the seventh planet of the solar system, taking detailed measurements of its trajectory in space.

Illustration of the Pull of a More Distant Planet Forty years later, French astronomer Alexis Bouvard published detailed tables describing Uranus' orbit about the sun. More than that however, his tables incorporated the lessons learned about planetary orbits from Johannes Kepler and Sir Isaac Newton to chart the path Uranus would follow into the future.

But then, something strange happened. Significant discrepancies between Bouvard's projected path for Uranus and its actual orbit began to be observed - irregularities that were not observed in the tables he had created to describe the orbital paths of the planets Jupiter and Saturn using the same methods. Soon, observations and detailed measurements confirmed that Uranus was moving along a path that was not described by Bouvard's careful calculations.

These irregularities led Bouvard to hypothesize that an as yet unseen eighth planet in the solar system might be responsible for what he and other astronomers were observing.

Voyager 2 Image of Neptune, emphasizing the 'Great Dark Spot' Over twenty years later, astronomer Urbain Le Verrier was working on the problem, taking a unique approach to resolving it.

What made Le Verrier's work unique is that he applied the math developed by Sir Isaac Newton to describe the gravitational attraction between two bodies to solve the problem. Here, he used Newton's theory to anticipate where an as yet unknown, but more distant planet also orbiting the sun would have to be to create the effects observed upon the position of the planet Uranus in its orbit.

Le Verrier completed his calculations regarding the position of the hypothetical eighth planet on 1 June 1846. A little over three months later, on 23 September 1846, the planet Neptune was observed for the first time at almost exactly the position in space where Le Verrier predicted it would be, confirming Newton's gravitational theory in the process.

We're going to do something similar today to explain why household income inequality in the United States has increased over time, even though there has been no change in individual income inequality.

From Darkness to Discovery

Our first chart below is based on data taken from the U.S. Census' data [Excel spreadsheet] on the inflation-adjusted median and mean income for all Americans from 1947 through 2010, which we've presented in terms of constant 2010 U.S. dollars. For reference, we've also indicated the NBER's official periods of recession in the U.S. during this period with the shaded red vertical bands on the chart:

U.S. Individuals Real Median Income with Recessions from 1947 through 2010

Next, we took the U.S. Census' breakdown of inflation-adjusted median income for both men and women for each of these years [Excel spreadsheet] and used the math that applies to log-normal distributions to construct the combined median income that applies to individuals. Our results are shown in the chart below, along with the actual median incomes reported by the U.S. Census so we can compare our calculated results with them:

U.S. Individuals Real Median Income by Sex with Recessions from 1947 through 2010

As you can see, our calculated results in creating a weighted median from the subsets of median income data for men and women are very close to the actual real median income numbers for all individuals. Here, because per capita income has been demonstrated to follow a log-normal distribution, we are able to use this math to either combine or extract subsets of data that have never been officially presented.

As an aside, we achieved the results above by treating the reported median income data the way we might calculate a weighted average. The beauty of the log-normal distribution math is that we can do this with medians, which we ordinarily could not do otherwise.

In the chart above, you can see the effect of the changing composition of the U.S. workforce, as the relative share of women earning incomes in the United States has increased since 1947. In 1947, the median income for individuals is much closer to the median income for men than it is for women. By 2010 however, we see that the median income for individuals is about halfway in between the median incomes for men and for women, reflecting that nearly equal share that both sexes now have among all individual income earners in the U.S.

Extracting The Unseen

The U.S. Census Bureau provides the median income data for individuals (or persons), men and women. It also reports median income data for both male and female wage or salary earners [Excel spreadsheet], whom we'll simply describe as Working Men and Working Women.

Using the math we demonstrated above with this data, we can extract the median incomes for two categories of people for whom the U.S. Census has never reported median incomes: men and women with incomes who do not earn wages or salaries, or as we'll describe them from now on, Non-Working Men and Non-Working Women! Today, we're putting what we found for all U.S. individual income earners together for the first time:

U.S. Individuals Real Median Income by Sex and Working Status with Recessions from 1947 through 2010

Constructing Households

Now, let's combine our median income earners into two-person households, pairing working men and women, working men and non-working women, non-working men and working women and finally non-working men and non-working women. We've shown our results below, along with the U.S. Census' official median income for U.S. households:

U.S. Couples Median Real Income with Recessions, 1947-2010

Well, look at that! The households formed by our single-wage and salary income earning couples from 1947 through 2010 closely parallels the actual real median income for U.S. households with a working man and non-working woman over that time (except for the years 1974 through 1977, where there seems to be an anomaly in the Census' data for working men - and here, the actual median splits the difference!) Also keeping in mind that the actual median household income might include the income contributions of additional people (say individuals between the ages of 16 and 24 who might be working part time at minimum wage jobs while also attending school and living at home with their parents), which likely accounts for the difference between the two, we've pretty much just demonstrated that we can successfully model basic U.S. households using just the data that applies for U.S. individuals.

But wait! What about single person households? Our next chart throws them into the mix as well!

U.S. Households Median Real Income with Recessions, 1947-2010

Using the figures for 2010, we approximated the income percentiles for each of our single and two-person median income earning households. The table below reveals our results (our model should put each approximated percentile within 0.2 of the actual percentile!):


Household Type 2010 Median Income Approximate Income Percentile
Working Men and Working Women $64,075 61.4
Working Men and Non-Working Women $50,026 50.7
Working Women and Non-Working Men $49,344 50.1
Non-Working Men and Women $35,295 36.7
Working Men Only $37,102 38.6
Working Women Only $26,973 27.7
Non-Working Men Only $22,371 22.4
Non-Working Women Only $12,924 11.5

It occurs to us that all we would need to increase the income inequality among households in the United States is to increase the nation's percentage of single person households among all households. That would work by increasing the number of households at the lower end of the income spectrum, even though it would have absolutely no effect upon the measured income inequality for individuals. The U.S. Census Bureau shows the change in the number of single person households since 1960:

U.S. Census Bureau: Percent of Single Person Households, 1960-2011

Here's the U.S. Census Bureau's Gini index measure of the amount of income equality among U.S. households for the years from 1947 through 2010:

Phil Wendt's Studio: Figure 1. Gini Index of Income Dispersion, 1947-2010

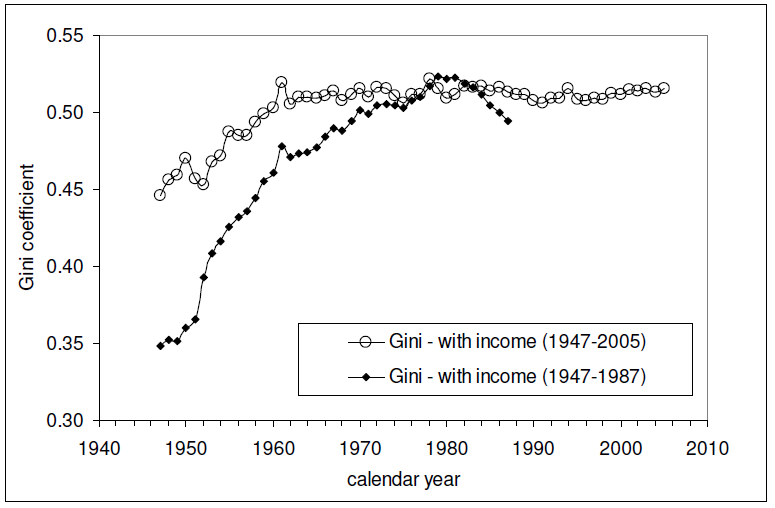
And here is the Gini index measure of the amount of income equality among U.S. individuals for the years from 1947 through 2005 (the data since 2005 is presented here - it's similar to all that recorded since 1960 in the chart below):

The relevant data in the chart above is the Gini measure indicated with the hollow circles, which is based on the "fine", or more detailed, income bins reported by the U.S. Census in its annual Current Population Survey. The other data in the chart, indicated by solid diamonds, represents income distribution data reported by the U.S. Census in larger, or more "coarse" income bins, which are less detailed and are therefore a much less accurate measure of the nation's level of income inequality in any given year.

Intersections and Connections

Looking at where all the data in these three charts intersect and overlap, What we find is that since 1960, the level of income inequality for U.S. individuals as measured by the "fine" Gini index is nearly constant, but has increased significantly for U.S. households. What has changed over that time is the composition of U.S. households, with a steady increase in the percentage of single person households.

Without a corresponding increase in the measured income inequality for U.S. individuals, the increase in the measured income inequality for U.S. households has been almost entirely driven by the increase in the number of single person households over time.

So income inequality among U.S. households isn't increasing because the rich are getting richer. That means that policies intended to right this situation by going after the rich in the name of "fairness" are guaranteed to fail, because the real cause of the increase in income inequality among U.S. households over time is something that cannot be fixed by such actions.

If only the people pushing such policies could see that....

And that concludes our eighth anniversary post. Thank you for joining us today - we greatly appreciate your choice to spend so much time with us (we really do try to draft shorter posts!)

Celebrating Political Calculations' Anniversary

Our anniversary posts typically represent the biggest ideas and celebration of the original work we develop here each year. Here are our landmark posts from previous years:

  • A Year's Worth of Tools (2005) - we celebrated our first anniversary by listing all the tools we created in our first year. There were just 48 back then. Today, there are nearly 300....

  • The S&P 500 At Your Fingertips (2006) - the most popular tool we've ever created, allowing users to calculate the rate of return for investments in the S&P 500, both with and without the effects of inflation, and with and without the reinvestment of dividends, between any two months since January 1871.

  • The Sun, In the Center (2007) - we identify the primary driver of stock prices and describe a whole new way to visualize where they're going (especially in periods of order!)

  • Acceleration, Amplification and Shifting Time (2008) - we apply elements of chaos theory to describe and predict how stock prices will change, even in periods of disorder.

  • The Trigger Point for Taxes (2009) - we work out both when, and by how much, U.S. politicians are likely to change the top U.S. income tax rate. Sadly, events in recent years have proven us right.

  • The Zero Deficit Line (2010) - a whole new way to find out how much federal government spending Americans can really afford and how much Americans cannot really afford!

  • Can Increasing the Minimum Wage Boost GDP? (2011) - using data for teens and young adults spanning 1994 and 2010, not only do we demonstrate that increasing the minimum wage fails to increase GDP, we demonstrate that it reduces employment and increases income inequality as well!

  • The Discovery of the Unseen (2012) - we go where so-called experts on income inequality fear to tread and reveal that U.S. household income inequality has increased over time mostly because more Americans live alone!

References

Kitov, Ivan. "Modeling the evolution of Gini coefficient for personal incomes in the USA between 1947 and 2005," MPRA Paper 2798, University Library of Munich, Germany. 2007.

Lopez, J Humberto and Servén, Luis. "A Normal Relationship? Poverty, Growth and Inequality". World Bank Policy Research Working Paper 3814, 2006.

Pinkovskiy, Maxim and Sala-i-Martin, Xavier. "Parametric Estimations of the World Distribution of Income". NBER Working Paper No. 15433. October 2009.

Political Calculations. The Distribution of Income for 2010: Households. 14 September 2011.

U.S. Census Bureau. Changing American Households. [PDF document]. C-SPAN. 4 November 2011. p. 6.

U.S. Census Bureau. Table P-2. Race and Hispanic Origin of People by Median Income and Sex: 1947 to 2010. [Excel spreadsheet]. September 2011.

U.S. Census Bureau. Table P-4. Race and Hispanic Origin of People (Both Sexes Combined) by Median and Mean Income: 1947 to 2010. [Excel spreadsheet]. September 2011.

U.S. Census Bureau. Table P-53. Wage or Salary Workers (All) by Median Wage and Salary Income and Sex: 1947 to 2010. [Excel spreadsheet]. September 2011.

Wendt, Phil. Income Disparity by the Numbers. Phil Wendt's Studio. 26 December 2011.

Kamis, 20 September 2012

Visualizing Income Inequality Since 1994

How is income inequality changing over time?

To find out, we've updated our chart showing the trends we find for U.S. individuals, families and households according to their Gini Coefficient as recorded by the U.S. Census since 1994 in the Annual Social and Economic Supplement it provides for its Current Population Survey, where a value of 0 indicates perfect equality (everyone has the same income) and a value of 1 indicates perfect inequality (one person has all the income, while everyone else has none):

U.S. Income Inequality for Individuals, Families and Households, 1994 to 2011

Why only from 1994? That's because the Census only began publishing its data online in an easy to access electronic format after 1993 (note the left hand margin here). The Census has published its older data online, but in the form of scanned documents that require a lot of manual effort to extract the data, which is also not as detailed as the newer versions.

Besides, it's not like the data since 1994 doesn't show the key trends for income inequality in the United States! Going to our chart, here is what we find:

  • The level of income inequality for individuals is essentially unchanged over time, holding flat within a fairly narrow range.

  • Once we begin combining individuals into families, we see a rising trend in income inequality over time.

  • Likewise, once we combine individuals into households, we also see a rising trend in income inequality over time.

Since income is predominantly earned by individuals (note that your paycheck is made out to you, not your spouse, roommate, parents or children), the only way these patterns can exist is if high income earning individuals are increasingly combining together over time to form families and households, or as is more likely the case, low income earning individuals are becoming less and less successful in forming families and households.

To see what we mean, here are the median incomes for individuals, households and families:

  • Individuals: $26,588

  • Households: $50,054

  • Families: $60,974

Note that the median income for families is more than twice that for individuals. That indicates that high income earners are indeed combining together to form these social units more often than low income earners.

Now, going back to the apparently unchanging level of income inequality over time for individuals, the only meaningful conclusion from data that can only be driven by economic, rather than social, factors. Russian physicist Ivan Kitov did the heavy lifting in calculating the population distribution functions that apply for the Personal Income Distribution (PID) in the United States. Here's what he found in looking at the same data since 1994:

Figure 4 depicts the population density functions, PDFs, for the years between 1994 and 2010. First, the estimates presented in Figure 1 were normalized to the total population for a given year. Then we reduced the income scale for individual years, i.e. from 1995 to 2010, by the total growth of real GDP. This allows normalizing the curves to the total income, i.e. we reduce all scales to that of 1994. Finally, we normalize the portions of populations in given bins to their widths for individual years and obtain the population density functions. Figure 4 proves that the distribution of personal incomes has not been changing over time in relative terms, i.e. a given portion of population always has a given portion of total income.

Some might say that the Census' data doesn't provide a full picture of the income distribution in the U.S., preferring instead to point to the IRS data for tax collections, which includes the effect of capital gains (much of which may be traced to once-in-a-lifetime events.)

As it happens, Kitov has examined that data too, going back to 1996 (when the IRS began reporting its statistics of income online):

Let’s take a look the data they used to prove the increasing inequality. The IRS measured incomes are usually referred to. Without loss of generality, we have retried “Table 1.1 Selected Income and Tax Items, by Size and Accumulated Size of Adjusted Gross Income, Tax Year 2009”. (Any other year between 1996 and 2009 is good as well.) This Table lists individual incomes in various income bins from $1 to $10,000,000. There are also 8274 reports of income above $10,000,000. We cannot use the latter incomes but definitely can plot the population density function for all incomes below $10,000,000. Figure 2 depicts the whole PID and Figure 3 its high income portion. The higher incomes are well approximated by a power low with an exponent of -3.07. (The difference of ~1.0 from the exponent for the BLS PDF (-4.1) is completely explained by the normalization to the total personal income reported by the BLS. It means that both exponents are identical.) It is likely that the same power law is valid at incomes higher than $10,000,000. Hence, there is no significant deviation (except measurement errors) from the Pareto distribution even at very high incomes and our extrapolation of the BLS incomes along the power law is valid for the calculations of Gini coefficients.

Conclusion: there is no growth in income inequality. Krugman et al. definitely exaggerate. As a Russian physicist, I have no political or any other emotional prejudice to the income distribution in the USA. I just calculate it.

Different data sets measuring the income distribution in the U.S., competent (and solid) analysis, same conclusion: there has been no meaningful change in the income inequality found among individuals for nearly the last two decades. The increase in the income inequality found for families and households over that time is the result of social, rather than economic, factors.

Senin, 17 September 2012

What's Your Income Percentile?

Where do you rank in the U.S. income spectrum?

Update 20 September 2013: Before going any further, please note that we've posted a newer version of this tool based on the most recently available data! Go here to find out more!

Now that the U.S. Census has released its total money income data it collected as part of its 2012 Annual Social and Economic Supplement survey, we can tell you almost exactly where you rank among American individuals, men (if you're a man), women (if you're a woman). Or, once you consider the combined income for your family or the members of your household, we can determine your percentile rank among each of those kinds of groupings!

It all starts below! Just enter your personal income, your family's income, which includes the incomes of your spouse and any dependents you might have, regardless of whether they live with you or not, and also the combined income of just the people who live within the same four walls of the household that you do and we'll tell you where you rank (if you're accessing this article through a site that republishes our RSS feed, click here to access the tool on our site.) And if you live outside the United States, be sure to convert your income into U.S. dollars first!


Income Data
Input Data Values
Your Personal Total Money Income
Your Family's Combined Total Money Income
Your Household's Combined Total Money Income


Cumulative Distribution of Total Money Income for U.S. Individuals, 2011Your Income Percentile
Individuals
- Men
- Women
Families
Households
   

The default data we've presented in the tool above represents the average total money income of U.S. individuals, families and households in 2011.

In the tool above, your percentile ranking indicates the percentage of Americans who either share your income or earn less than you do. As such, it tells you what percentage of the population you're above in the income earning food chain.

For example, a percentile ranking of zero would indicate that you are at the very bottom end of the American income spectrum, while a percentile ranking of 100 indicates that you are effectively at the very top end. A percentile rank of 50.0 would indicate that you're within spitting range of being the middle of all Americans (our tool should be able to place most people within 0.2% of their actual percentile ranking.)

In considering your percentile ranking, here's how many income-earning people, families and households there were in 2011:

  • Individuals: 214,559,000

    • Men: 106,228,000

    • Women: 108,332,000

  • Families: 80,529,000

  • Households: 121,084,000

And here are our charts showing the cumulative distribution for U.S. families (left) and households (right). Click the images for larger versions:

Cumulative Distribution of Total Money Income for U.S. Families, 2011 Cumulative Distribution of Total Money Income for U.S. Households, 2011

The U.S. Census will report the data it collects for income earned in 2012 sometime in September 2013.


Kamis, 16 Agustus 2012

Men With and Without Wage and Salary Income

Now that we've tested our median income extraction math upon the U.S. Census' income data for women, we're going to repeat the exercise today for the Census' income data for men.

Our chart below shows what we found when we generated the inflation-adjusted median income data for both wage or salary earning men and what we extracted from the data for non-wage or salary earning men from the Census' Current Population Survey results for each year from 1947 through 2010, expressed in terms of constant 2010 U.S. dollars:

Men's Median Real Income in the U.S., with Recessions, 1947-2010

The chart is very different from what we observed for women. Starting first with the Census' published data for men with wage and salary income, we see that men just more than doubled their inflation-adjusted wage and salary incomes from 1947 through 1974, rising from $19,844 to just over $41,400, which corresponds to a real annualized growth rate of 2.6%.

But after that, men's median wage and salary income nose-dived in 1977 to a level around $35,000, plus or minus $2,000, about which it stagnated for the next twenty years. In 1997, it jumped up to a level around $38,000, about which it stagnated again in a range within $2,000 of that mark.

We should note at this point that the Census' data only counts money income - it does not include non-monetary compensation, such as health insurance benefits, that individuals earning wage or salary income commonly enjoy.

The more remarkable story though is for men with non-wage and salary income.

Here, we observe that men in this category had a much more slowly rising median income in the years from 1947 through 1965, increasing from an inflation-adjusted level of $16,155 to just $20,654, for a real annualized growth rate of just 1.4%.

In 1965 though, we find that non-wage or salary income earning men had a sudden jump to nearly $27,000 in their median incomes, after which we observe that this value has since settled into a range centered about $25,000, plus or minus $4,000 for all the years since.

That was surprising to us because we had expected that the median income data for this group would follow the same pattern we had observed earlier for women: basically flat up until after 1965, when the launch and growth of the U.S. government's Medicaid and Medicare programs might provide a steadily rising source of income for non-wage or salary earning men.

Instead, we find that other than what might be described as a one-time only benefit, the median income for men with non-wage or salary income has essentially stagnated since 1965.

We also find that non-wage or salary earning men would seem to be much more vulnerable to periods of recession than their wage and salary earning counterparts. Generally speaking, they see much deeper and longer periods of declines in their median incomes, indicating greater levels of economic distress.

We should note here that our non-wage or salary earning men include those who earn income from self-employment or through investments, which might account for much of that apparent greater sensitivity to economic downturns.

Rabu, 15 Agustus 2012

The Wages of Women

Today, we're showing off our newfound ability to extract median income data for a particular sub-population given just what we know for the full population and another sample sub-population within it!

That sounds pretty boring, right? What do you say we liven it up a bit by noting that the full population for our example today represents all women with money income of one kind or another in the U.S. for the years of 1947 through 2010, while the sample sub-population within that group represents the women who earned wage or salary income over that period of time?

From those two bits of officially published data, we can work out the median income of all the women whose income came from everything but wages and salaries! Our results are presented in the inflation-adjusted terms of constant 2010 U.S. dollars in the chart below, where we've shown the median income for the combination of both men and women along with the median incomes of all women, the median incomes earned by women with jobs (or rather, those with wage and salary income) and the median incomes of women without jobs:

Women's Median Real Income in the U.S., with Recessions, 1947 - 2010

Looking at the data for women with wage and salary income, we find that initially, the median income for women was largely flat for the years from 1947 through 1960, hovering around the $9,900 to $10,000 mark in the inflation-adjusted terms of 2010 U.S. dollars.

After 1960 though, we see a steady rise - one that seems to be largely resistant to recessions. As of 2010, the median income for women with wage and salary income has risen by a factor of nearly 2.7 to $26,973, for a real annualized growth rate of 1.9% per year.

Update 23 April 2013: What you're about to read next has turned out to be off target - instead of pacing changes in Medicaid and Medicare, the median income of the non-wage or salary earning women has instead turned out to be largely pacing changes in Social Security benefits paid to women over time, which have often coincided with changes in Medicaid and Medicare. See here for more information....

Looking at the new data we've extracted for the median incomes of women with non-wage or salary income, what we find is really the story of Medicaid and Medicare over time.

Here, we see that after initially dipping in the years from 1948 through 1951 and recovering in 1952, the median incomes for women with non-wage or salary income was essentially flat at a level around $4,500 from then through 1965. Beginning in 1966 however, we find that the median incomes of these non-wage or salary earning women began to rise, reaching $12,924 in 2010, which works out to be a real annualized growth rate of 2.4% since 1965. As it happens, the timing and magnitude of that rise coincides with the launch of both Medicaid and Medicare in the late 1960s.

In fact, we can see much of the growth in the median incomes of non-wage or salary earning women paces the U.S. government's average spending per Medicare beneficiary for each year from 1966 through 2010:

Annual Medicare Spending per Beneficiary, 1966-2010

And so, we see that government assistance in the form of Medicaid and Medicare is largely responsible for much of the observed growth of the median income of non-wage or salary earning women over the last 45 years.

Still think what we're doing is boring?

Notes

The published data for women's wage and salary income has a pretty unique anomaly for the years 1974, 1975 and 1976. It appears that the U.S. Census' data jocks were off by 10,000,000 in their estimates of the number of working women in each of those years, or about 25% of the actual figures, which in turn, led the Census to over-estimate the median income for women in those years by a similar percentage.


Selasa, 14 Agustus 2012

Men, Women, Income and Recessions

We're revisiting the average and median incomes of men and women in the U.S. today because we've been using that data behind the scenes to prove out whether or not we could successfully determine these values for a combined population using only that data for the component sub-populations that make up the combined population, or vice versa.

As it happens, we could get pretty close to the actual values. The mean (average) income data was fairly easy to do, which we've shown below in our updated chart, where we've also indicated periods of recession (for the sake of not duplicating the chart we had previously posted and for providing additional context):

Mean Real Income in the U.S. by Sex, with Recessions, 1947 - 2010

The trick here for calculating the average income of the combined population was to calculated the weighted average for the sub-populations - our results nearly matched the actual values recorded by the U.S. Census.

Working with the median income data however was a bit more difficult. Here, we took advantage of the fact that the distribution of income in the U.S. follows a log-normal pattern, which means that if you calculate the natural logarithm of income before graphing the distribution, the data will follow the normal, bell-curve shaped distribution that is pretty common in statistics.

Using the math that applies for log-normal distributions, we took the mean and median income data for the sub-populations and calculated their respective population means and standard deviations. We then took the weighted average of their population means, from which we calculated the median income for the combined population in each year, from which we got results that were really close to the actual values, paralleling them from 1947 through 2010.

Median Real Income in the U.S. by Sex, with Recessions, 1947 - 2010

When we say "really close", each of our calculated values were within about 2% of the actual values recorded by the U.S. Census in its Current Population Survey results. In the chart above, we multiplied our results by a scale factor of nearly 1.02 to shift our calculated values upward to more closely align with the actual values.

This isn't just an academic exercise. The real reason we've gone through this whole procedure is because we're going to be using the same math to extract information from the Census' annual income distribution data that has never really been examined before and we needed a test case to show that it works. And while we won't have the benefit of being able to check our results against actual data, you can reasonably expect that the trends we'll be presenting in that project will directly parallel the actual ones, and will very likely be within about 2% of them as well.

That's the beauty of the math!

Kamis, 09 Agustus 2012

Men, Women, Income (Part 2)

We're continuing our series on men, women and income in the United States today, with our first stop being a look at the number of individual men and women counted as having income in the years from 1947 through 2010:

Number of Men and Women with Incomes in U.S., 1947-2010

In this chart, we see that the number of men earning incomes in the U.S. has grown at a fairly steady rate since 1947. But what's remarkable is that the number of women earning incomes in the U.S. has grown much faster, at least for the thirty years from 1947 through 1977. And then, the number of women earning incomes surged by over 14.5 million to surpass the number of men in the next two years, before settling in afterward to grow at a near equivalent rate of growth as that for men in all the years since.

Our next chart features the inflation-adjusted median income for men, women and combined for the years from 1947 through 2010, which we've presented in terms of constant 2010 U.S. dollars. Since the U.S. Census has only published the median income data for all Americans earning income in the years from 1974 onwards, we used the Census' median income data for men and women separately for each year since 1947 to estimate what the the combined median income would be for the years before 1974. Our results are below:

Median Real Income in the U.S. by Sex, 1947 - 2010

As best as we can tell, the apparent sudden shift in employer hiring preferences for women after 1977, which we observe in both the number of women with incomes with respect to men and the growing median income of women in the years since, combined with the greater sensitivity of men's median income to periods of economic recession, likely accounts for the stalling out of real median income growth for men in the years from 1977 through 1996.

Since 1996, the trend in median income growth for both men and women have been more similar, although it still appears that men's median income is still much more sensitive to economic downturns.

Rabu, 08 Agustus 2012

Men, Women, Income

Here at Political Calculations, we occasionally generate some really interesting charts and data as we work on other projects behind the scenes. With that in mind, we've tapped the U.S. Census' income data going back to 1947 showing the average income earned by individual men and women in the U.S., and also the combined average income for all individual Americans.

Average Real Income in the U.S. by Sex, 1947-2010, Constant 2010 U.S. Dollars

What makes the chart somewhat more interesting is that it captures the changing distribution of the U.S. work force by sex over the years, which we can see in the relative placement of the combined mean income line with respect to the lines for men and women.

Starting in 1947, we see that there were more than 2 men for every 1 woman in the work force at that time. That was changing rapidly however as the relative number of women in the U.S. workforce grew steadily until 1979, when women slightly outnumbered men in the U.S. work force for the first time.

And for that matter, every year since 1979 as well! Overall, the U.S. workforce has been very nearly equally balanced by sex since that time, with women peaking at 51.13% of the U.S. work force in 1988. In 2010, the percentage of women in the U.S. work force was 50.2%, just barely over half.

It's also interesting to note that since 1947, the annual average income earned by all individual women has nearly tripled, while the income for men has increased by a factor of 2.1. Meanwhile, the average income earned by all Americans has gone up by slightly less, doing just better than doubling in value during the time from 1947 to 2010.

That's largely due to the greatly increased number of women working today as compared to 1947, combined with their generally lower incomes. Although women's incomes have risen much more quickly than men, their greater numbers in the work force combine with their lower incomes overall to produce the result where average income in the U.S. has grown more slowly than it has for either men or women separately.

Rabu, 22 Februari 2012

The Billionaire Decay Function

The Billionaire Decay Function

Previously, we built a tool to calculate the probability that an individual could keep earning at least $1 million dollars annually after having done it once.


Today, we're headed for the stratosphere of annual income earners to see just how long they can expect to stay on top after they become one of the Top 400 taxpayers in the United States!


Our tool below is based upon data covering the years from 1992 through 2008 about the Top 400 taxpayers published by the IRS. Technically, these individuals aren't necessarily "billionaires", but all have earned anywhere from a low of at least $22,559,000 in 1993 ($20,397,000 in terms of constant 1990 U.S. dollars) to at least $138,815,000 in 2007 ($87,525,000 in constant 1990 U.S. dollars) to be able to be counted among the IRS' "Top 400" in the years from 1992 through 2008!


Time Data
Input Data Values
Number of Years After Becoming a Top 400 Taxpayer


Probabilility of Being a Top 400 Taxpayer
Calculated Results Values
Probability of Being a Top 400 Taxpayer After Entered Number of Years


Running the numbers, compared to just making one million dollars in a year, it's a lot less likely that a U.S. taxpayer will make the Top 400 of all U.S. taxpayers more than once! In fact, after 17 years, the IRS data suggests that only one individual made the list in each of the 17 years for which it has been reporting its data.


The IRS notes the high amount of changeover in the Top 400 U.S. taxpayer from year to year:


Over the 17 tax years a total of 6,800 returns were identified for the table. There were 3,672 different taxpayers representing the top 400 returns of each year. Of these taxpayers, a little more than 27 percent appear more than once and slightly more than 15 percent appear more than twice (see columns 2 and 3). In any given year, on average, about 39 percent of the returns were filed by taxpayers that are not in any of the other 16 years (see columns 4 and 5). In each year, 4 (or 1.0 percent) of the returns are for taxpayers who can be found in all 17 years. Thus, the data shown in the table mostly represent a changing group of taxpayers over time, rather than a fixed group of taxpayers.


You know what they say - it's nice to make it to the top, but good luck staying there!


Data Source


Internal Revenue Service. The 400 Individual Income Tax Returns Reporting the Highest Adjusted Gross Incomes Each Year, 1992-2008. 1 August 2011.